Profitability: Separating the Wheat from the Chaff

- Develop and communicate a Business Management Strategy based on urgency and sound Cost Management Principles. Understand and address the activities, services, operational practices, and customers that drive costs and ultimately profitability. Incorporate planning tools such as Balanced Scorecard, Strategy Maps, and Performance Management along with common sense.But how do you begin? Begin by completing a comprehensive review of your business operations. Assess necessary actions such as:
- Strategic planning for your Business, including sales, marketing and production
- Financial strength and capability to finance future growth
- Adequacy and utilization of resources, including capital, direct and indirect labor, equipment, technology and facilities
- Efficiency and effectiveness of your key business processes, i.e., sales, accounting, engineering, operations, maintenance, etc.
- Management leadership and personnel skills
- Costing capabilities, including availability and accuracy of data
- The last point listed above – Costing Capability – is probably one of the hardest items to accurately establish. You need to look at your revenues via a “Value-Added” approach using the formula VA = SR – (MC + OS) where VA is value added, SR is sales revenues, MC is material costs and OS is outside servicing costs. This value-added approach will begin to crack the hull of the wheat grain and allow you to peer inside your business operations. You need to establish the true costs associated with your business operations; those costs directly associated with individual products and specific customers. You need to define “Cost Drivers”, i.e., Machine Hours, Labor Hours, Square Footage, etc. that can be used to calculate $ Overhead / Unit numbers. You need to accurately “allocate” specific costs to designated cost centers or product lines. Where do indirect personnel spend their time? What resources are assigned to specific areas, processes or product lines? How much floor space is consumed for specific machines or product lines? Where are the utilities consumed?As a recent example, we worked with a Louis metal fabricating company to implement a roadmap to analyze and improve profitability. Starting with a value-added approach, the company soon identified gross margin percentages that quickly indicated which products, cost centers and customers were the least profitable. Yes, there was overhead absorption by the “losers”, but the company’s ability to strategically plan and expand had been clouded. The old saying “what you can’t see won’t hurt you” is just not true. Try asking an electrician!The company’s core business is metal stamping. Available machine hours were 1,800 per machine per week. Actual measured machine hours per week averaged out at 1,152 per machine. That’s a utilization rate of 64% (1,152/1,800 = 0.64). The company allocated costs to specific cost centers and utilized the cost driver of machine hours to determine manufacturing overhead rates. In this company, the manufacturing overhead rate, after allocation of specific costs, was determined for various production cells. Values ranged from $89/machine hour to $134/machine hour. It was valuable detail that was needed to make changes and improve operations.
The results of the profitability analysis and subsequent improvement action steps were dramatic; a) the company focused sales and marketing efforts on those products and processes that generated the highest true margins. b) the company, armed with accurate cost analysis data, negotiated with customers to address losing products. The 12 month results were impressive. They went from a $30,000 per month running loss to a $521,417 net-net profit.
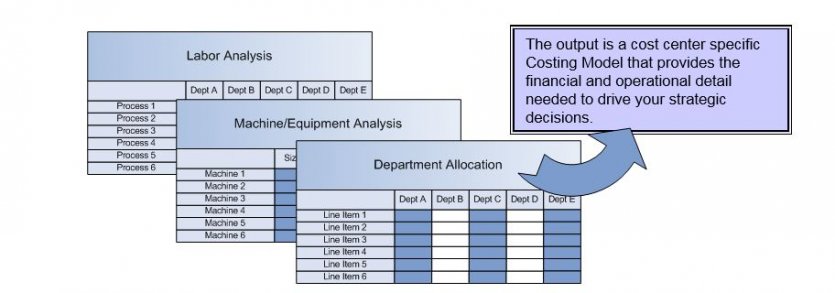
A viable Costing Methodology incorporates a detailed analysis of your business operations including, Labor, Machine/Equipment Efficiencies, Overhead, Process Capability & Performance, and deliverable Services.

- The old adage “what gets measured gets improved” continues to be true. In order to achieve profitability, a disciplined Performance Management Framework needs to be identified and established. Key Results Indicators (KRIs) provide the “Dash Board” to inform management as to business health and goal achievement. KRIs must be measured, trended and acted upon by senior management. KRIs include measures such as Customer Satisfaction, Net Profit Before Tax, and Profitability of Service.In order to sustain profitability, Key Performance Indicators (KPIs) need to be identified and established for each business process. KPIs must be measured frequently (e.g. daily), trended and acted upon by department management. These indicators have a significant impact on the whole organization and provide an early warning indication of a pending process breakdown. KPIs include measures such as Indirect/Direct Labor Hours, Machine Rates/Hour, Errors & Omissions, Rework $/Labor Hour, Cost Overruns, Revenue per Employee, Overtime Hours, etc. KPIs need to follow the 3-C rule; Clear, Concise and Communicated.
- An injection molding company. 22 molding machines providing 230 different products to 30 different customers. Following the 80/20 rule, a detailed review of the top individual Product Routers, that are used to control production, was completed. These routers specified cycle times, material use percentages, scrap rates, finished part weights, etc. The results; every router was inaccurate in at least one item. Data was precise. Just not accurate. This data had been used as the premise to secure a large contract that necessitated a $2,800,000 expansion. Results were disastrous. The expansion building is now available for sale or lease.
- A road contractor that specializes in preparing the road surface for repaving. Eight machines chewing up asphalt on a daily basis. Machines range in age from six to ten years old. Business has been going down over the past three years. Their data was inaccurate and, in most cases, non-existent. The company was unable to track repairs, fuel consumption, efficiencies, etc. in order to make strategic decisions regarding machine replacement. The “guesstimated” costs of fuel/hour, repairs/hour, overhead/hour, etc. were all off base. After capturing true data, the company was able to efficiently and accurately quote machine rates for each individual unit. The results – the company sold four units, purchased one new unit and expanded their reach into a new market area.
Hear more from Alan during FABTECH Session F15: Accelerating Profitability: Tools and Strategies for Long Term Success on Wednesday, November 16, 2016 from 8:00 AM – 10:00 AM. Session Details. [x_author title=”About the Author”]